
Queue Management and Turnaround Time Analytics
An HMIS-integrated queue and TAT platform built to make every outpatient stage visible and support the Door-to-Doctor-in-3-Minutes goal.
The challenge
The outpatient journey crossed registration, triage, consultation, laboratory, imaging, billing and pharmacy, but leaders did not have one live view of where a patient was waiting or which service point owned the delay. A long total visit could not easily be separated into registration delay, queue-to-call time, arrival-to-service time or time spent inside a room.
The operational target was ambitious: move the patient from arrival through registration and triage to the doctor within three minutes. Achieving that required more than a waiting-room display. Management needed stage-level timestamps, ageing alerts and room-level evidence to find bottlenecks, compare departments and guide staffing or process changes before poor experience became a complaint.
What I built
I connected HMIS-linked ticket generation, appointment and navigator workflows, department and room routing, call and recall actions, arrival and service statuses, transfers, public displays and management reporting into one queue operating model. Each stage records the patient journey from entry through call, arrival, service, completion or transfer.
The TAT layer separates queue-to-call, call-to-arrival, arrival-to-start and closed-stage turnaround. It also keeps long-running open stages visible as ageing exceptions instead of incorrectly treating them as completed TAT. Supervisors can filter by zone, department, room, status and period, then move from the summary directly to the tickets requiring intervention.
How the organisation benefits
The platform turns the three-minute ambition into a measurable management practice. Supervisors can see where pressure is building, identify patients exceeding the target, compare rooms and departments, and distinguish waiting delay from service duration. That supports faster service recovery, better staff allocation and focused improvement conversations with the service point where time is actually being lost.
The same evidence creates accountability over time: management can monitor whether corrective actions reduce the relevant stage delay rather than relying on anecdotes or a single end-to-end average. Patients benefit from clearer routing and earlier intervention when their journey stalls.
Delivery reality
Queue analytics are only credible when frontline status actions reflect reality. A missed arrival, completion or transfer can leave an open stage ageing for hours and distort the operational picture. I designed simple actions, status validation and separate reporting for completed measurements versus open exceptions, then paired rollout with training and management follow-through.
The three-minute target also cannot be achieved by software alone. Registration practices, triage readiness, room availability, clinician response, network reliability and local patient volumes all shape performance. The system makes those dependencies visible so departments can act on evidence rather than treating TAT as an IT metric.
System narrative
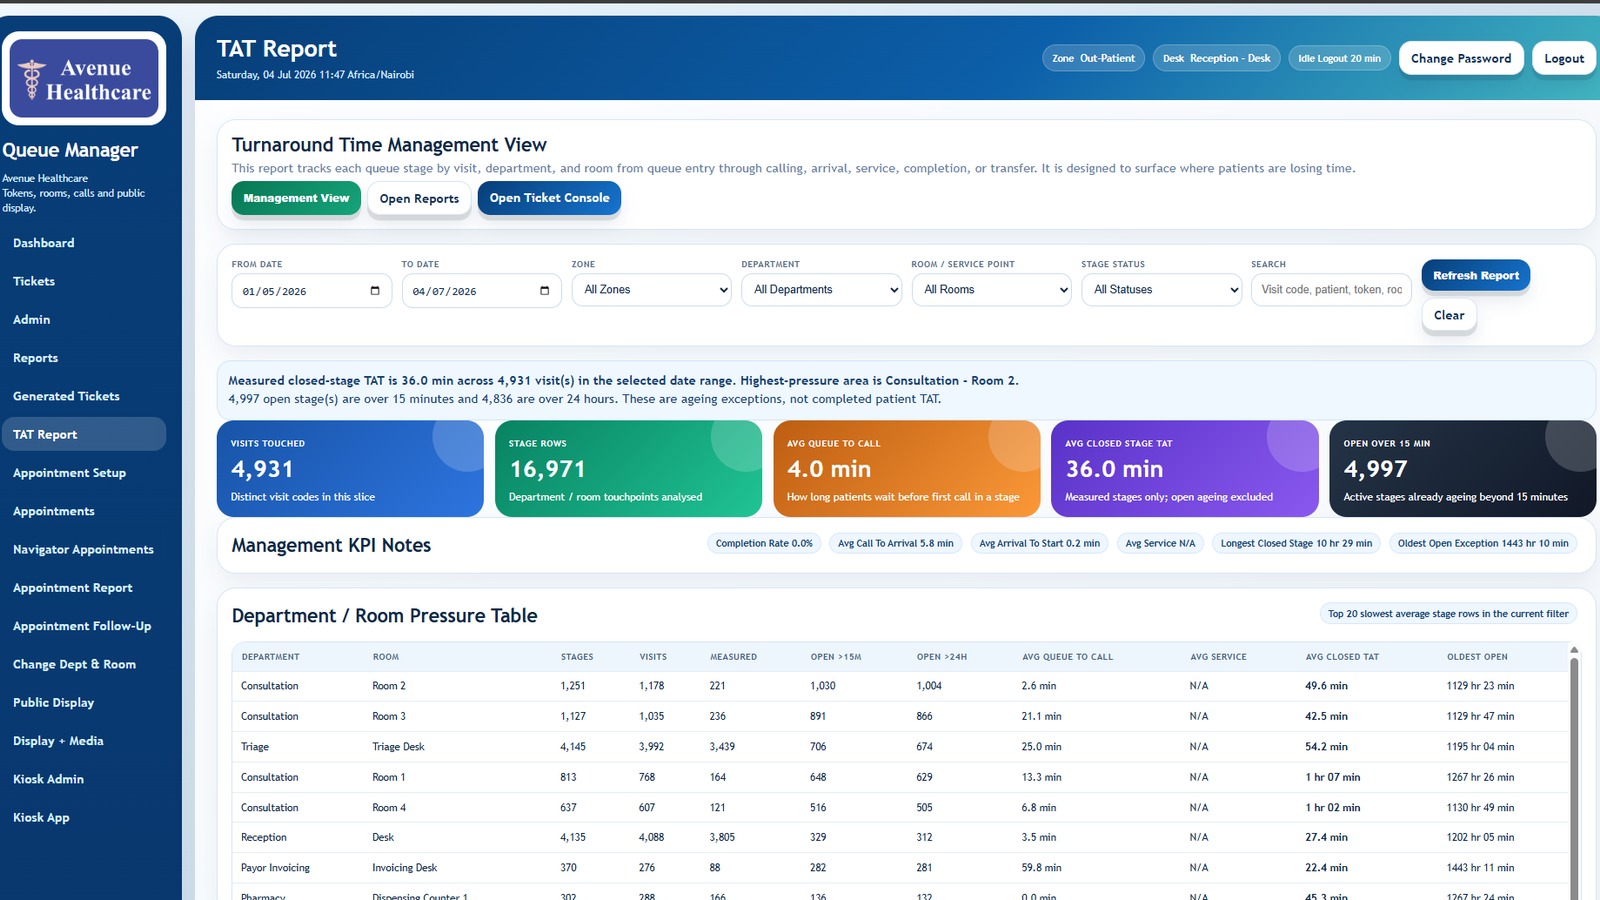
This view connects the patient journey to the room and department where time is being lost. Supervisors can see measured closed-stage turnaround alongside active ageing exceptions, which keeps incomplete journeys from being mistaken for completed TAT.
The result is an operational accountability tool: leaders can direct support to the highest-pressure service points, distinguish queue-to-call delay from service delay and follow up on long-running open stages.
More operational case studies.
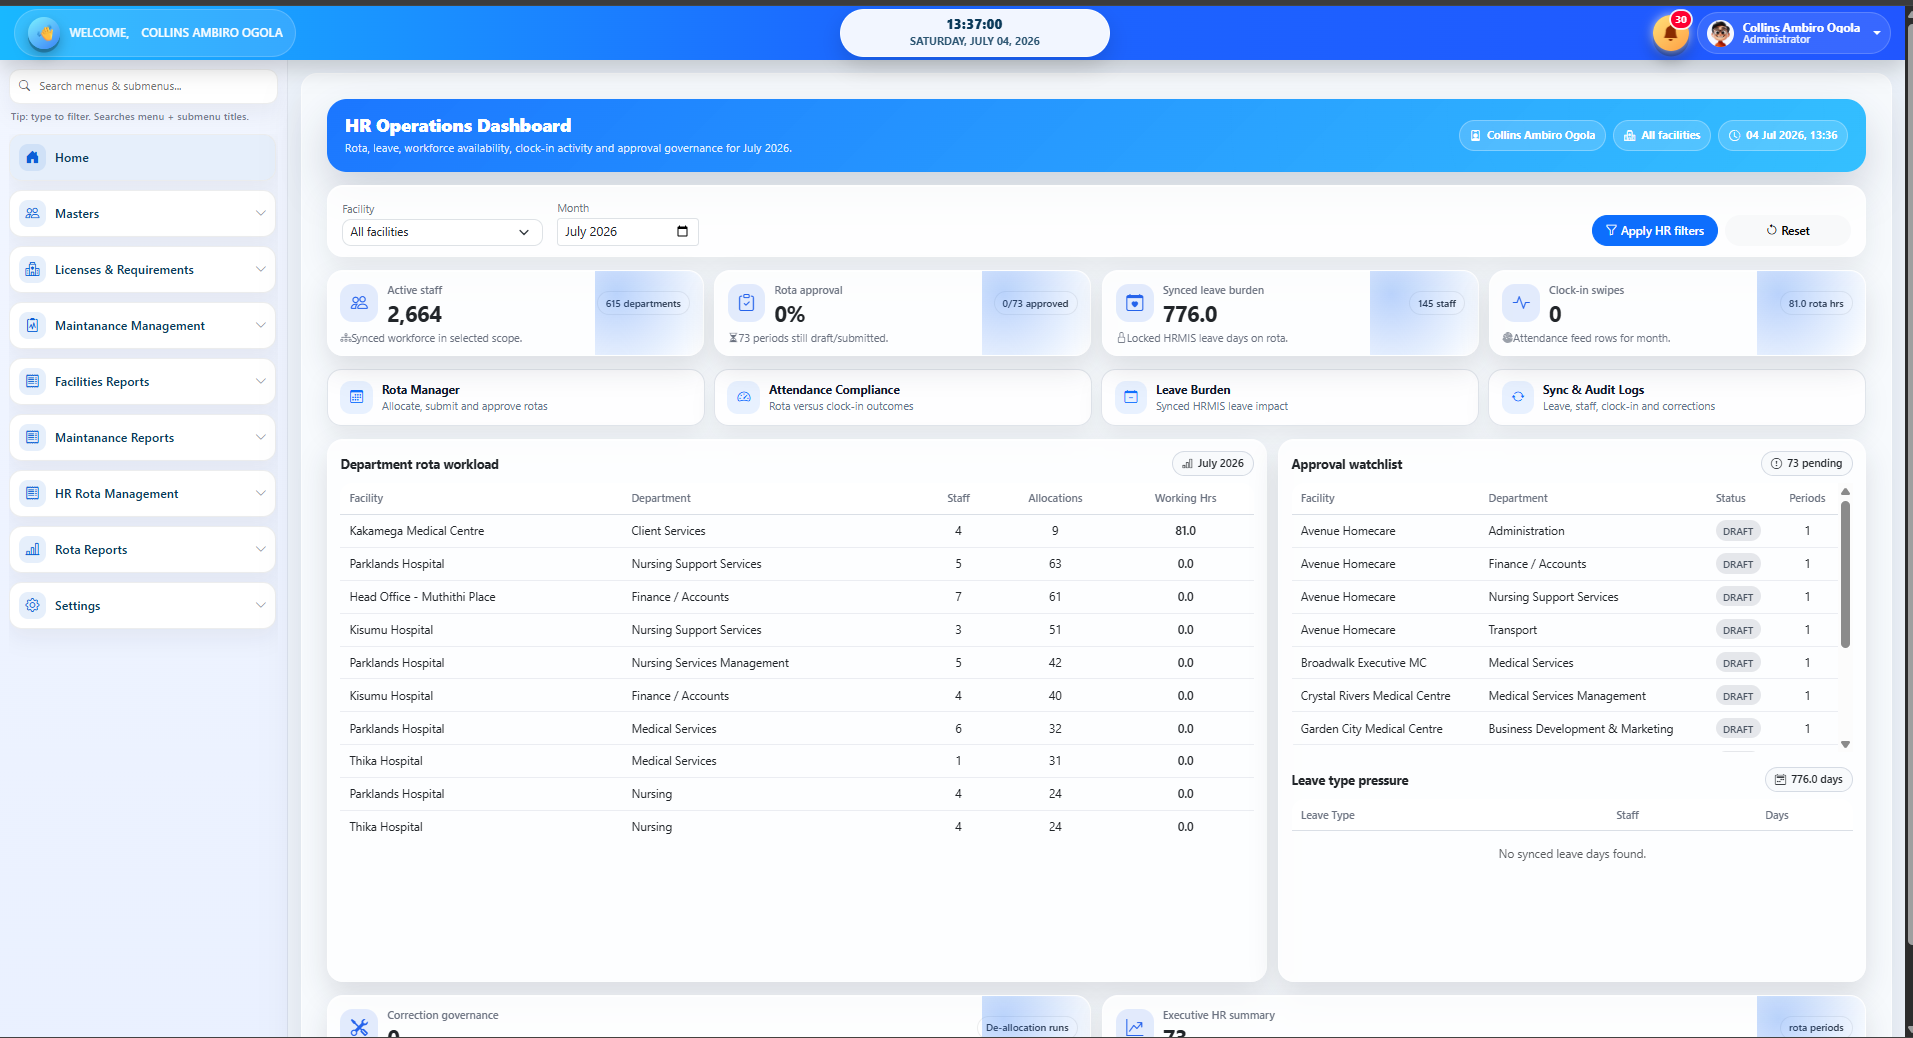
Workforce Rota, Clock-in Compliance and HR Analytics
A controlled workforce platform that replaces fragile rota spreadsheets with approved shifts, leave, locum governance, clock-in/out evidence and defensible hours-to-pay analysis.
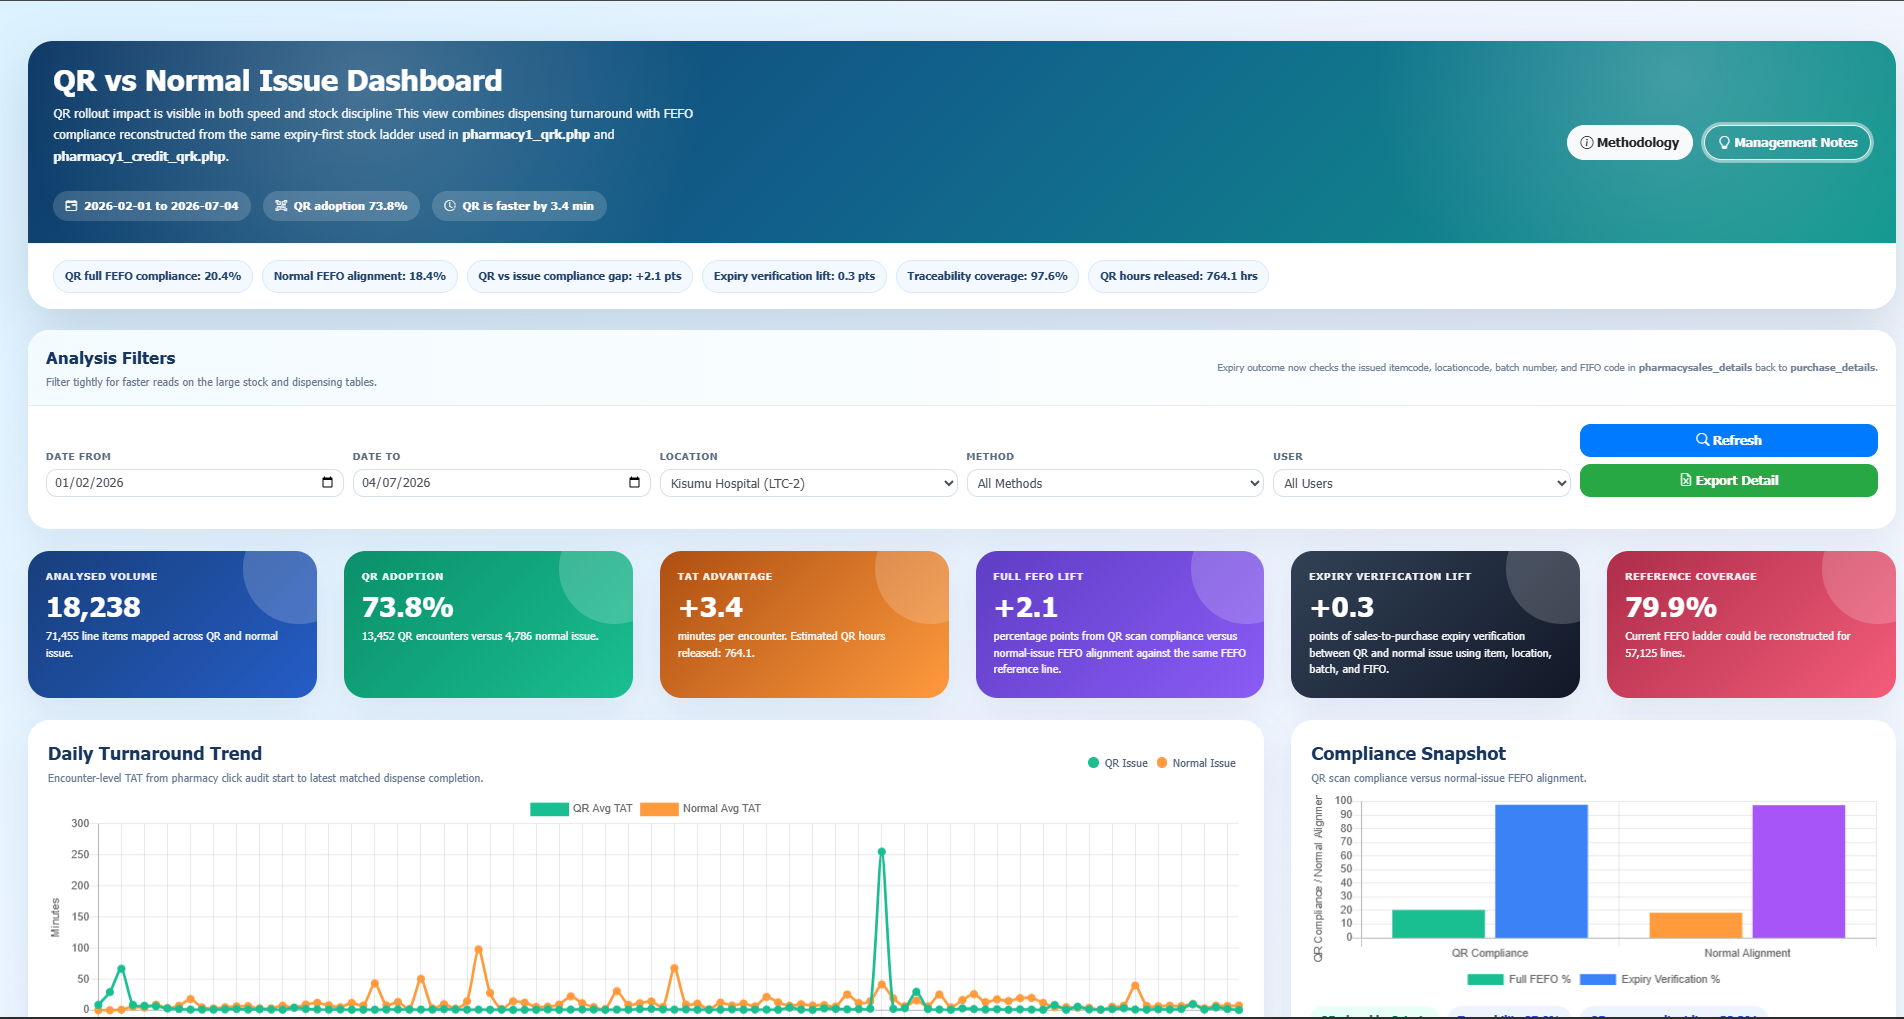
QR Scanned Pharmacy Dispensing and FEFO Compliance
A scan-controlled inventory workflow that embeds item, batch, expiry and FEFO checks from goods entry through stock taking, transfers, issues and returns.