
Kitchen Management and Meal Efficiency Dashboard
Meal ordering, production, service confirmation and ingredient reconciliation translated into an executive operating view.
The challenge
Meal operations generated demand, production, service and ingredient records at different points in the workflow. Management could see food ordered or issued but could not reliably reconcile what was produced, what reached the patient and what remained unconfirmed. Treating every difference as waste risked overstating loss and blaming the kitchen for downstream plating, delivery or confirmation gaps.
Leaders needed a controlled production-to-service view that connected meal-period demand to recipes, ingredient consumption and final service evidence, while preserving a clear queue for unresolved portions.
What I built
I linked patient meal ordering, bill-of-material recipes and inventory usage to a production-to-service funnel. The dashboard separates ordered, produced, served and pending-confirmation portions, then adds meal-period efficiency, ingredient quantities and values, item-level reconciliation and formal PDF reporting.
Instead of forcing an early waste classification, the workflow retains pending portions for investigation across production, plating, delivery, OTP confirmation and status closure. This gives each department a clearer point of accountability.
How the organisation benefits
Across 1-4 July 2026, the system recorded 4,716 ordered portions, 3,981 produced, 879 served and 3,102 pending service confirmation. It showed 84.4% production conversion and 22.1% confirmed service efficiency. These measures give leaders a precise reconciliation queue rather than an unsupported wastage assumption.
Management can now direct investigation to the correct stage, compare meal periods and items, and connect operational variance to ingredient use and value. The outcome is stronger cost control, service accountability and data quality without presenting unconfirmed activity as proven loss.
Delivery reality
The most important design decision was semantic: pending is not the same as wasted. A portion may be plated, in transit, served without OTP confirmation or simply left open in the system. I retained those distinctions and made workflow closure visible so management can correct the process before drawing a financial conclusion.
Reliable analysis also depends on accurate recipes, units of measure, item masters and disciplined service confirmation. Delivery therefore combines BOM validation, operational ownership and follow-up on outstanding records rather than relying on a dashboard alone.
System narrative
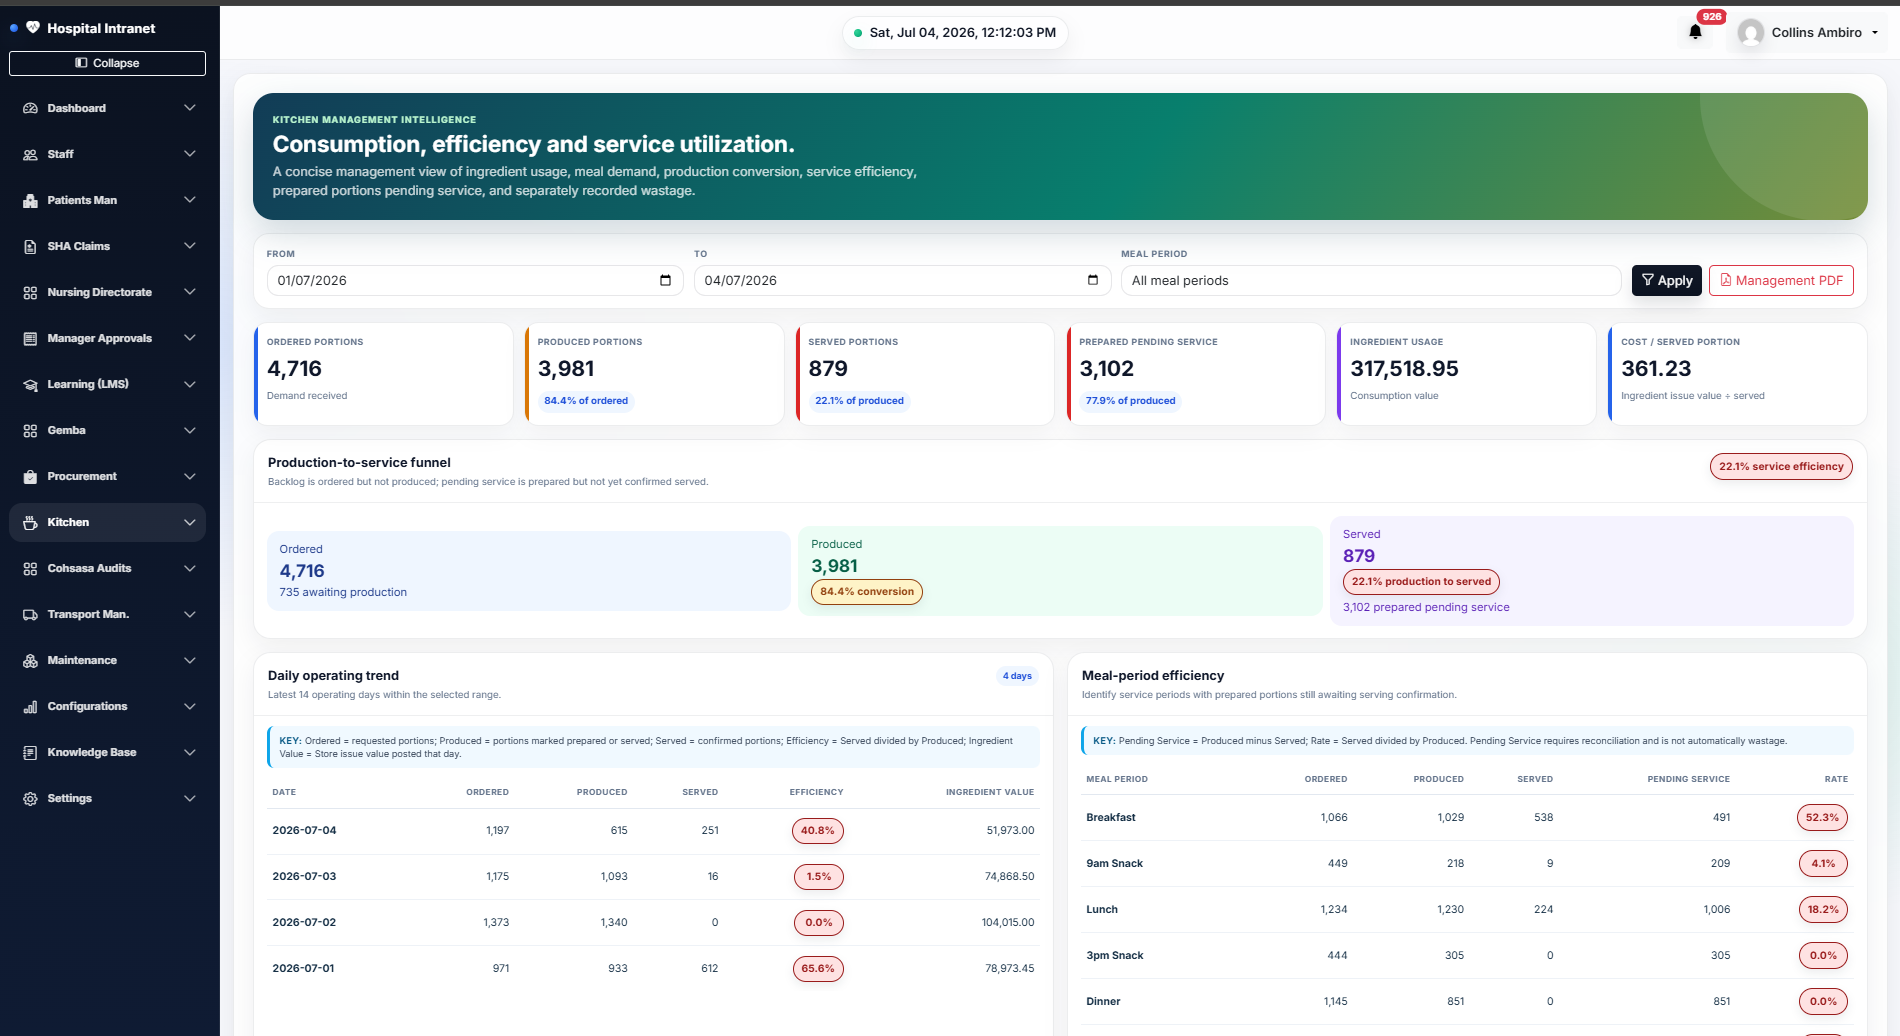
The dashboard converts meal operations into a production-to-service funnel. Leaders can see demand, production conversion, confirmed service, ingredient consumption and the portion backlog in one management view.
Crucially, the system labels 3,102 portions as pending reconciliation rather than automatic waste. That protects the integrity of the analysis and directs managers to investigate plating, delivery and service-confirmation gaps before classification.
More operational case studies.
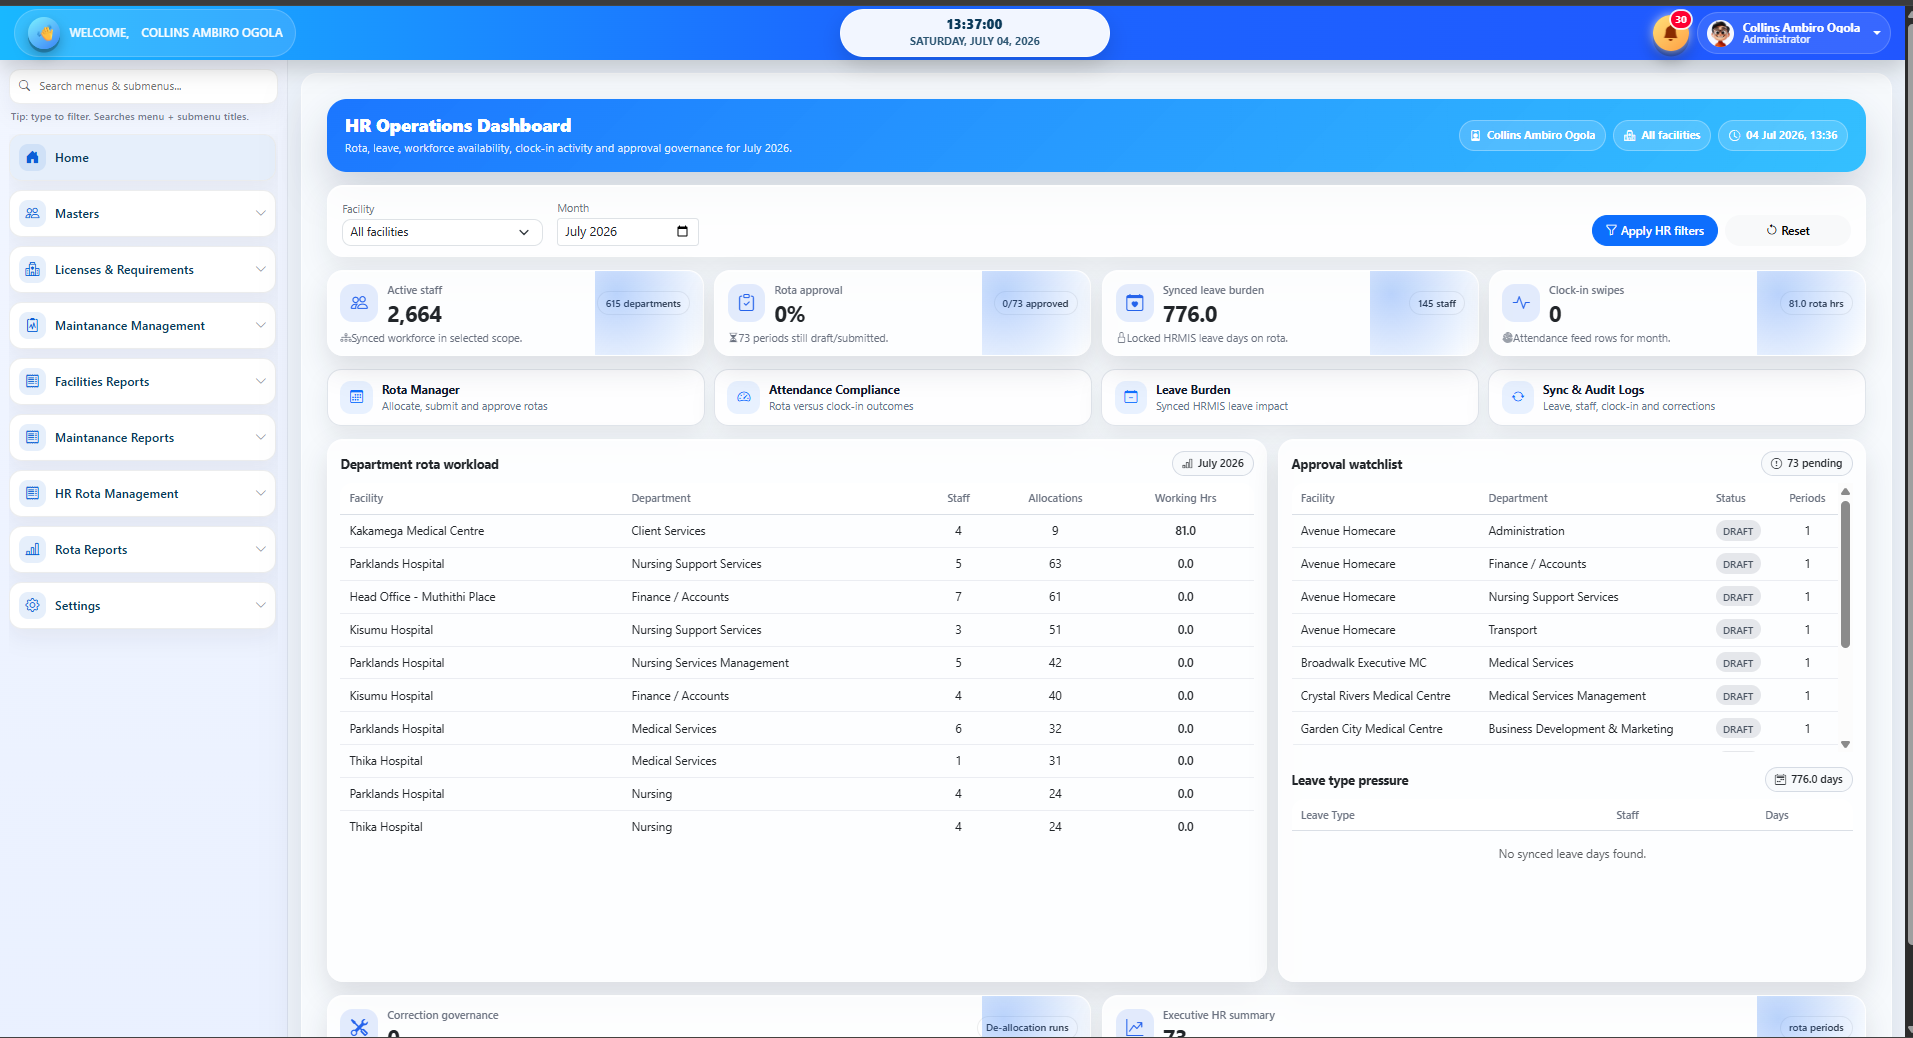
Workforce Rota, Clock-in Compliance and HR Analytics
A controlled workforce platform that replaces fragile rota spreadsheets with approved shifts, leave, locum governance, clock-in/out evidence and defensible hours-to-pay analysis.
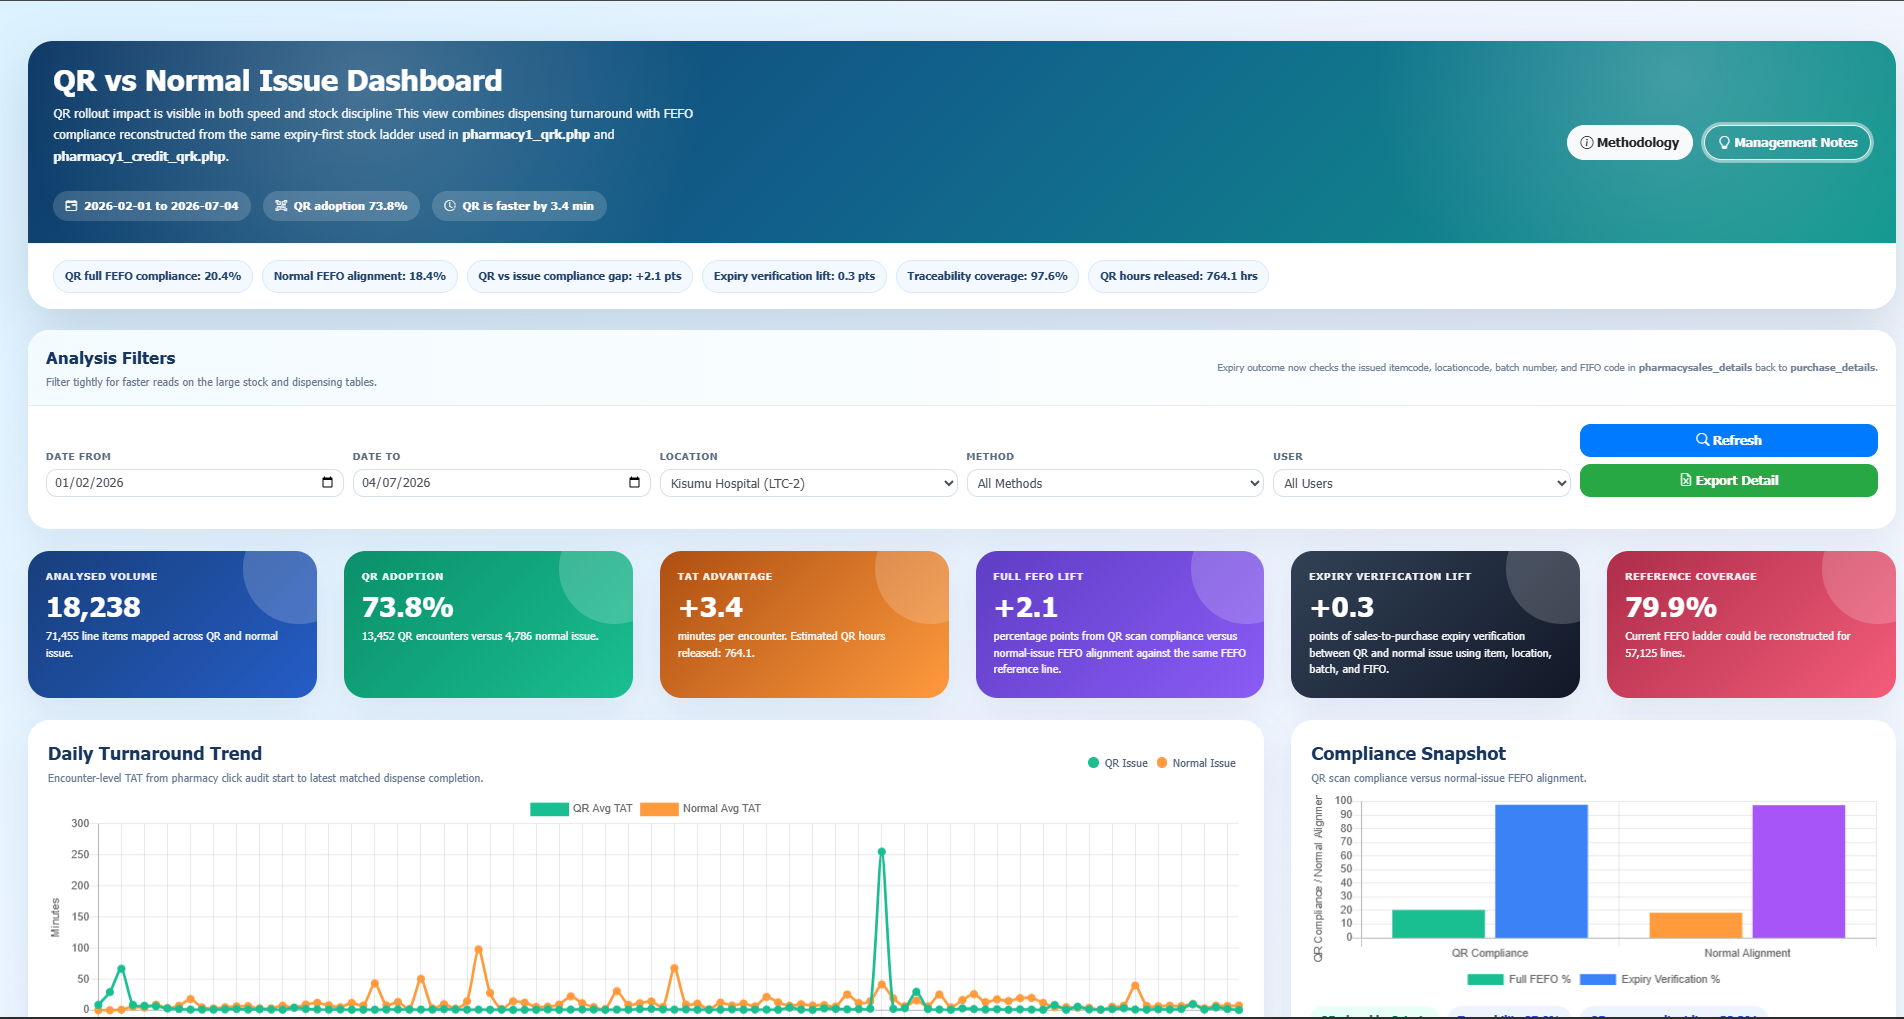
QR Scanned Pharmacy Dispensing and FEFO Compliance
A scan-controlled inventory workflow that embeds item, batch, expiry and FEFO checks from goods entry through stock taking, transfers, issues and returns.