
Executive Dashboards and BI Reporting
Operational data translated into focused management signals for pharmacy, patient flow, clinical services and branch performance.
The challenge
Transactional systems recorded activity but did not always answer the leadership questions behind it: where is performance changing, who needs support and what action should follow?
What I built
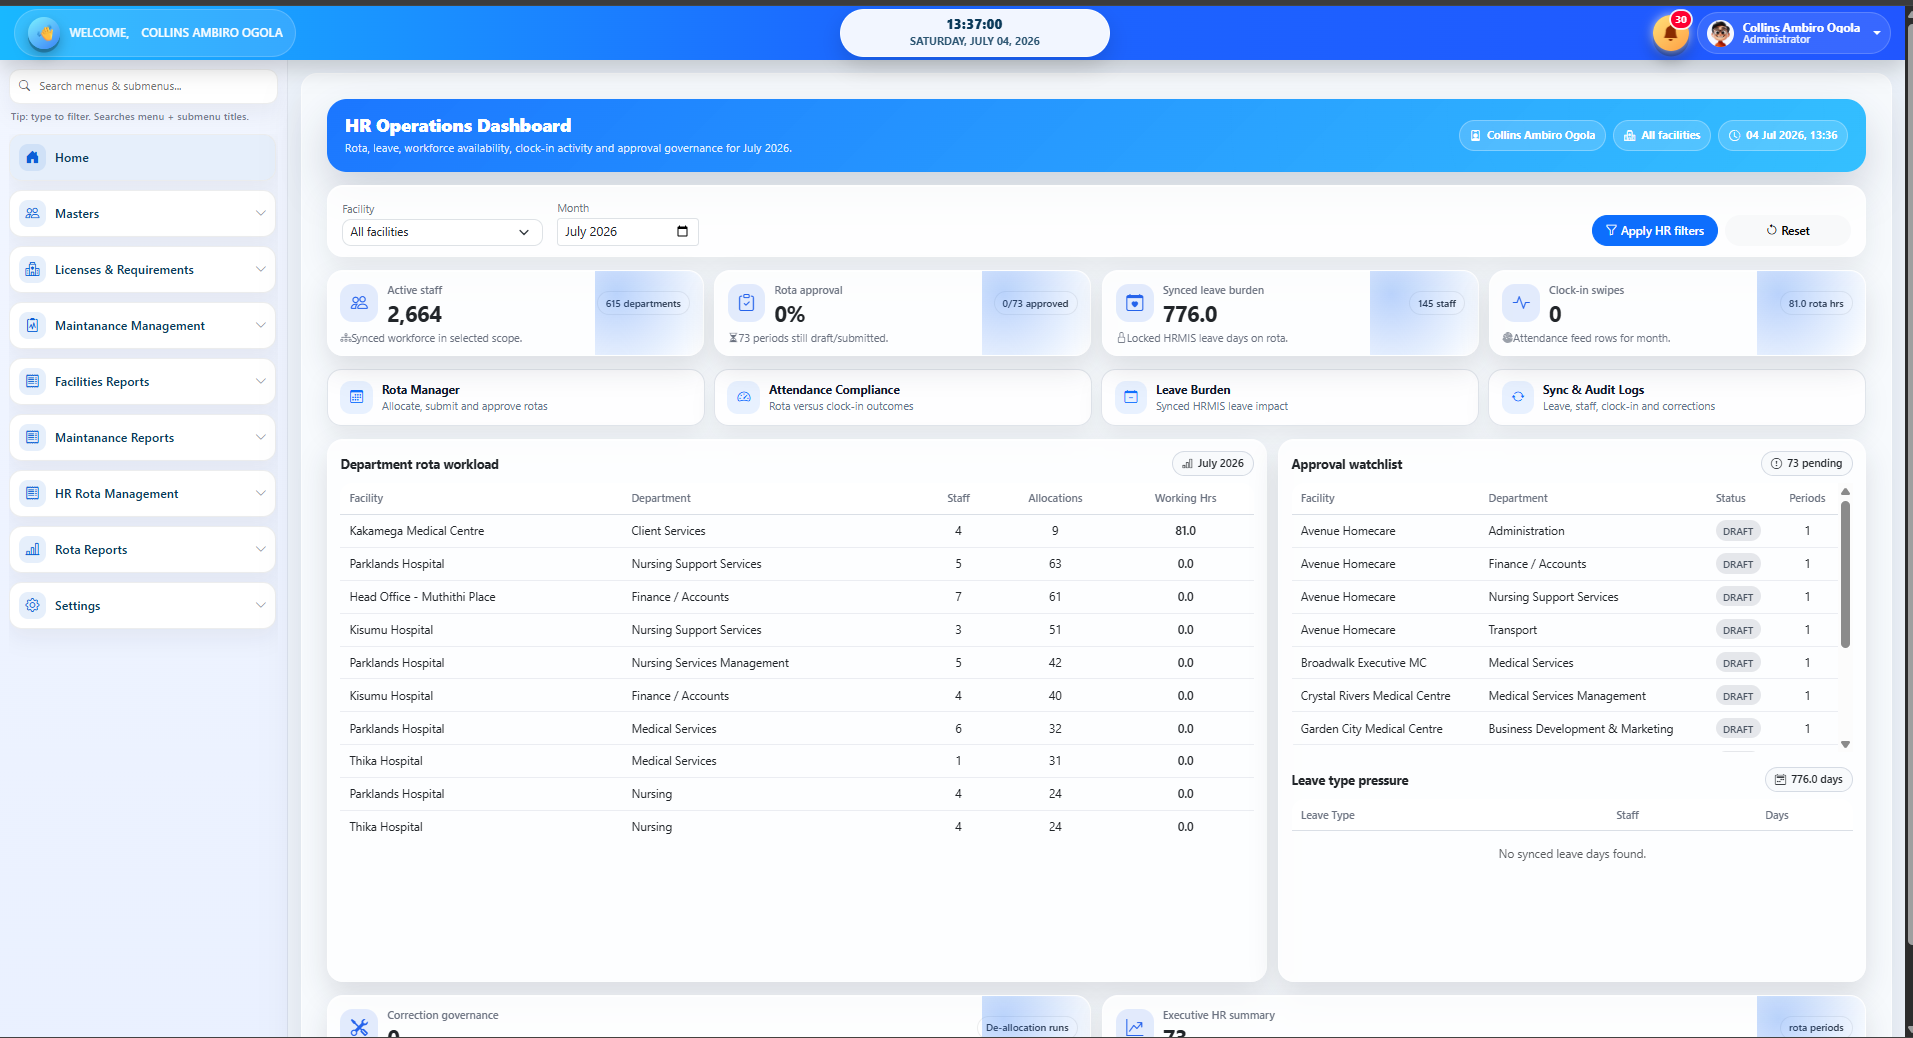
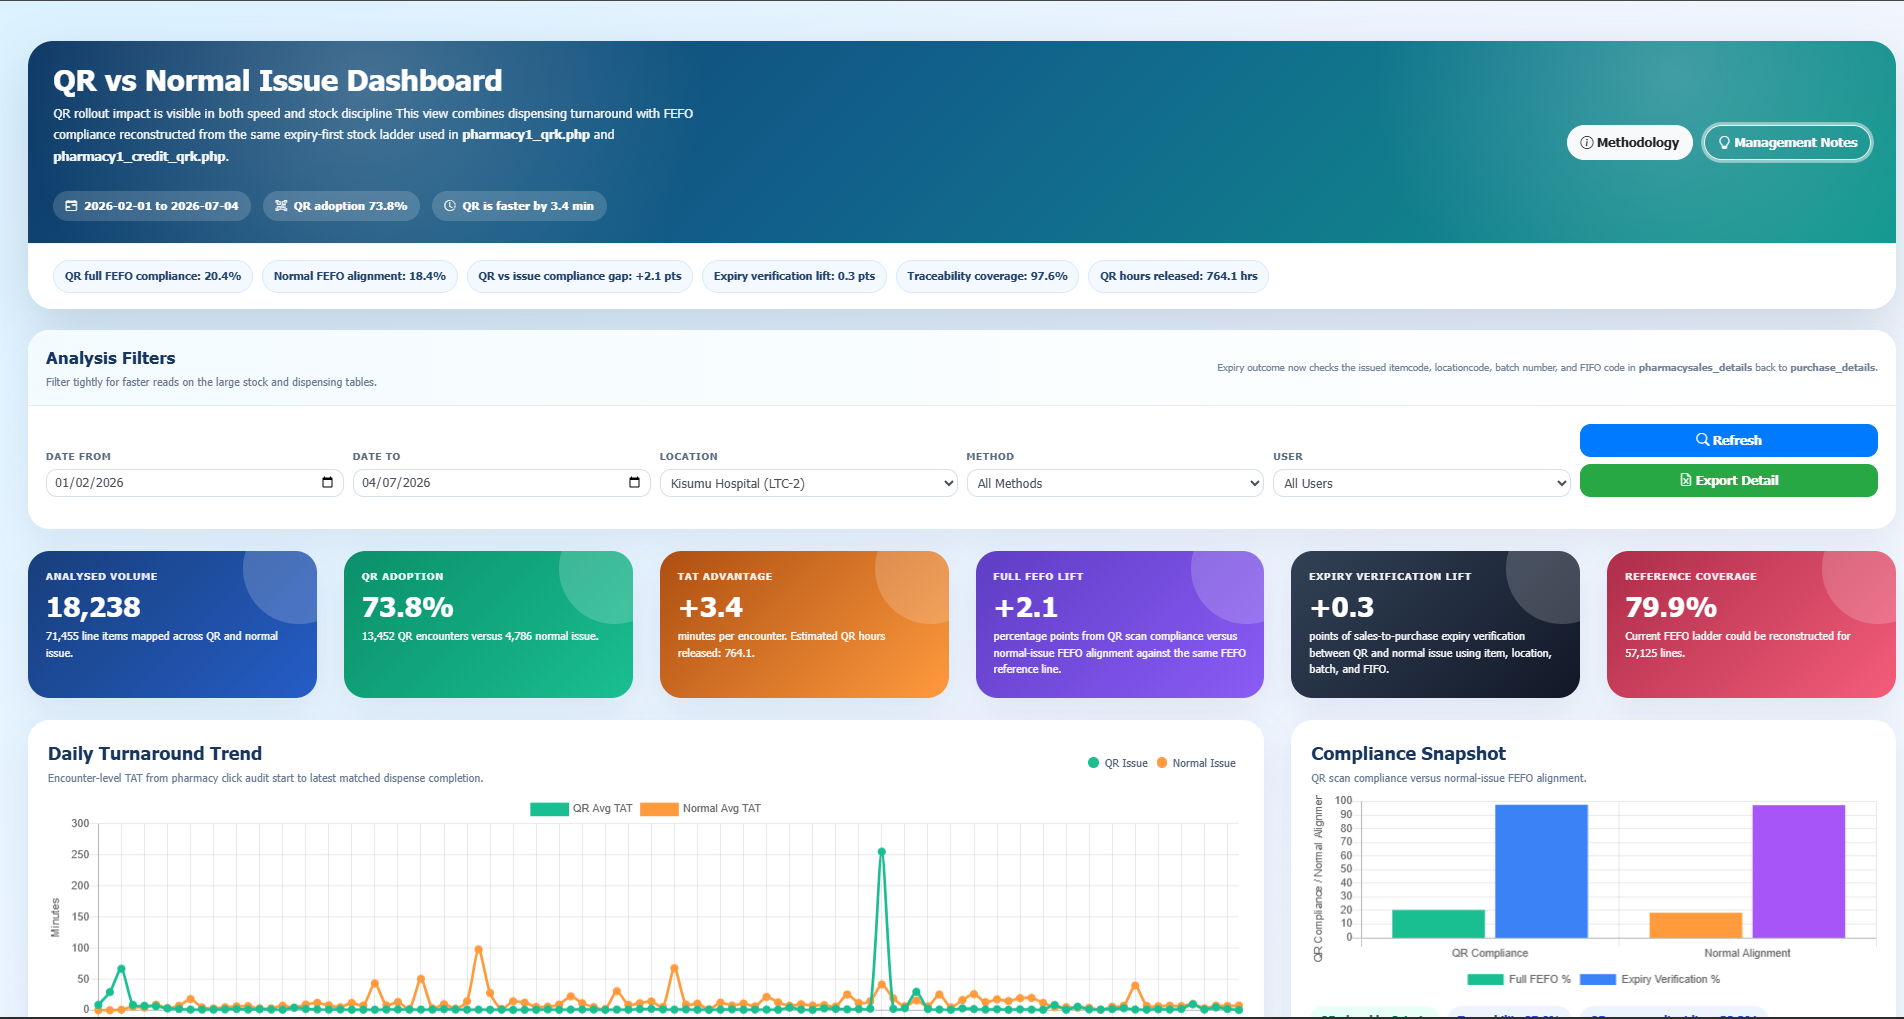
I developed executive dashboards and reports for operational KPIs, pharmacy QR adoption, FEFO compliance, TAT advantage, user performance, branch comparison, kitchen efficiency, data quality and workflow exceptions.
How the organisation benefits
The dashboards turn operational data into management action. Leaders can compare performance, target coaching, validate adoption and discuss process evidence in daily huddles and executive reviews instead of waiting for manually assembled reports.
Delivery reality
A polished chart is only useful when its definitions and data lineage are trusted. I align measures with operational owners and expose the methodology behind important indicators.
System narrative
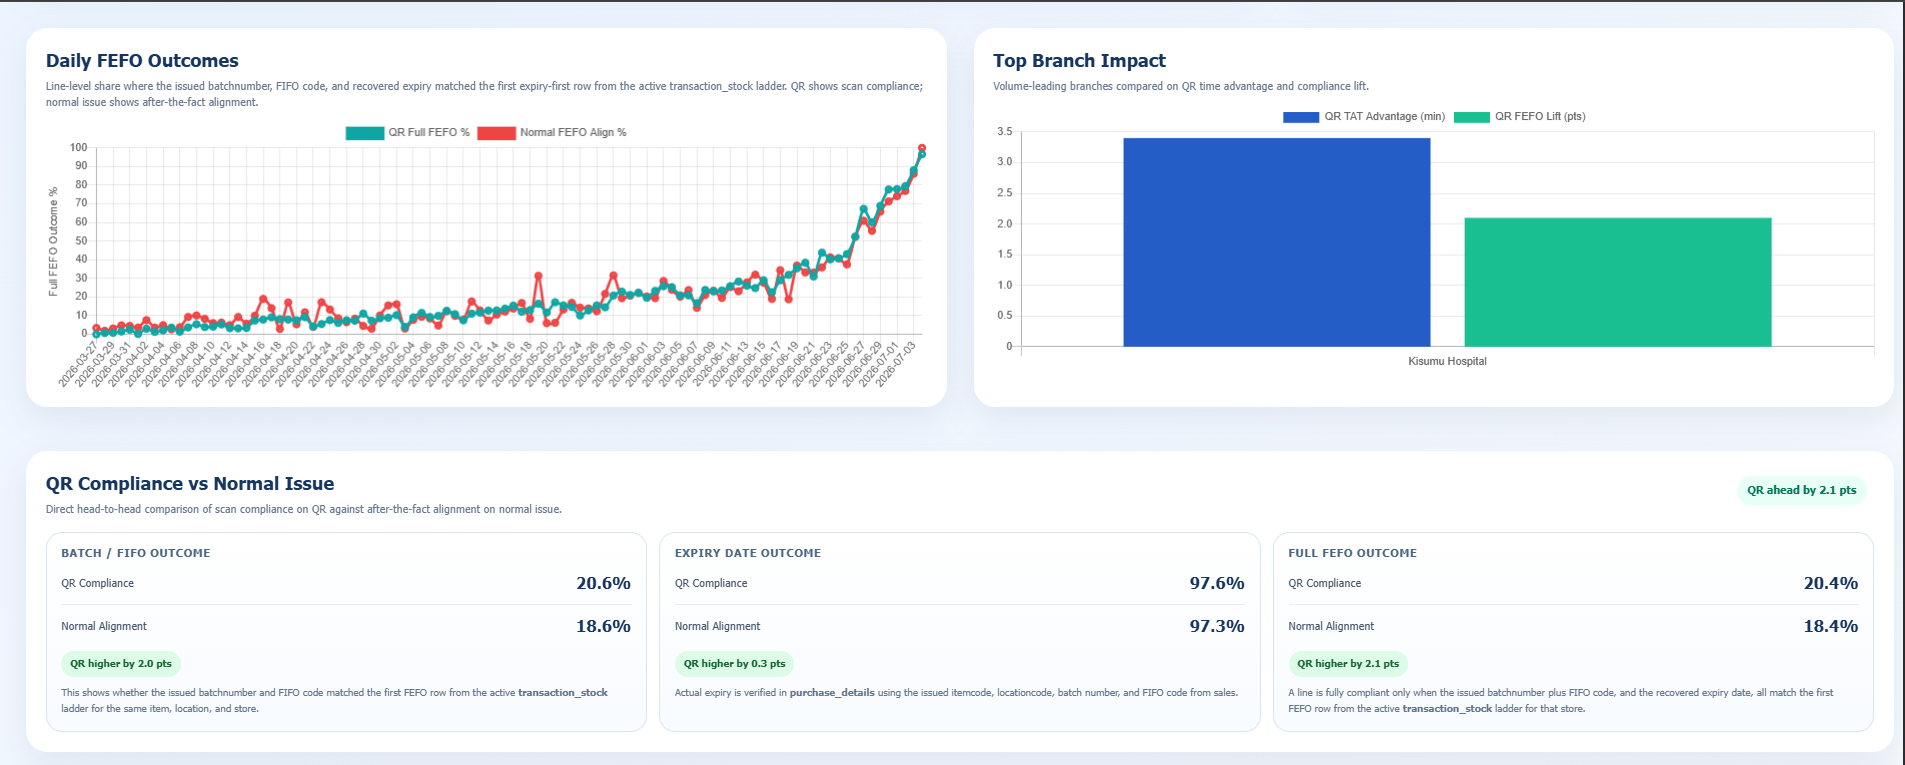
This example shows how detailed transactions can be translated into an executive comparison of trend, operational lift and branch performance. The same method applies beyond healthcare wherever leaders need trustworthy operational KPIs.
I build dashboards with visible definitions and traceable measures so that management discussions can move from opinion to evidence and targeted action.
More operational case studies.
Workforce Rota, Clock-in Compliance and HR Analytics
A rota planning and attendance-governance platform that connects scheduled shifts, employee clock-in/out evidence, leave and facility-wide HR performance.
QR Scanned Pharmacy Dispensing and FEFO Compliance
A traceable dispensing and stock-control workflow that turns QR adoption, expiry verification and FEFO discipline into management evidence.